

As a senior software engineer at Talentica, I’ve often seen how scaling observability becomes a challenge once applications start handling real-world traffic. In such scenarios, Graylog proves to be a strong fit. Built for modern log analytics, it removes complexity from data exploration, compliance audits, and threat hunting, so users can quickly and easily find meaning in data and take action faster.
However, running Graylog in cluster mode isn’t straightforward. The lack of concrete setup guidance can slow teams that need a highly available, resilient, and production-ready deployment. Based on my implementation experience, this article walks through the key considerations and steps to run Graylog in a clustered setup on Kubernetes.
But before diving into “how,” it’s worth understanding why cluster mode is the approach that pays off in the long run.
Why Run Graylog in Cluster Mode?
A clustered Graylog setup provides:
- High availability – If one pod fails, others can continue serving traffic.
- Scalability – Handle higher ingest rates by adding more nodes.
- Separation of concerns – Distribute roles between leader and non-leader nodes.
- Consistent external access – End users and applications can reliably connect via a load balancer.
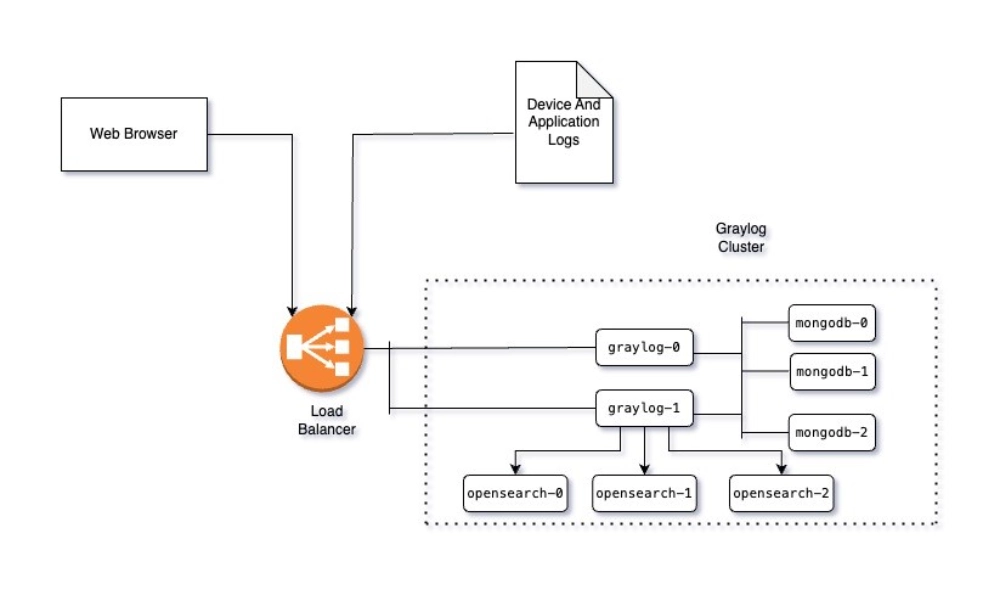
Now that we know why cluster mode matters, here’s how the architecture looks in practice
The architecture at a glance
Implementation walkthrough
Step 1. Configure EKS
I used a dockerized environment to set up Graylog. For demonstration, I deployed this on AWS EKS. You can use EKS cluster in the following way:

Step 2. Setting up MongoDB cluster
Next, I configured the dependencies for the Graylog cluster, starting with MongoDB, which stores the metadata of the Graylog cluster.
I deployed the MongoDB statefullset using:
kubectl apply -f mongodb-statefull.yaml –namespace=graylog
Once MongoDB is up and running, you can expect to see output similar to this:

Then, I configured MongoDB replicaset:
  mongo // get into mongo shell
	db.runCommand("ismaster") // to check if it is master
	rs.initiate({
		_id: "rs0",
		members: [
		{ _id: 0, host: "mongodb-0.mongodb.graylog.svc.cluster.local:27017" },
		{ _id: 1, host: "mongodb-1.mongodb.graylog.svc.cluster.local:27017" },
		{ _id: 2, host: "mongodb-2.mongodb.graylog.svc.cluster.local:27017" }
		]
	})
	rs.status()
	//we should see 1 primary and rest as secondary.

   Once all the nodes successfully joined the cluster, i tested the connection using:
	nc -zv mongodb 27017
Step 3. Set up OpenSearch cluster
Once MongoDB was ready, I moved on to OpenSearch cluster, which stores the actual data as indices. I deployed it using:
kubectl apply -f opensearch-statefull.yaml --namespace=graylog
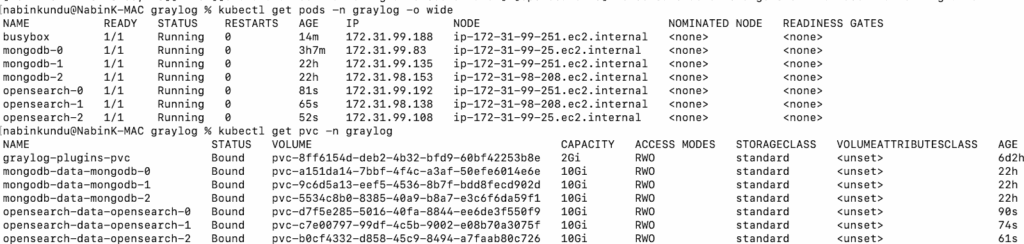
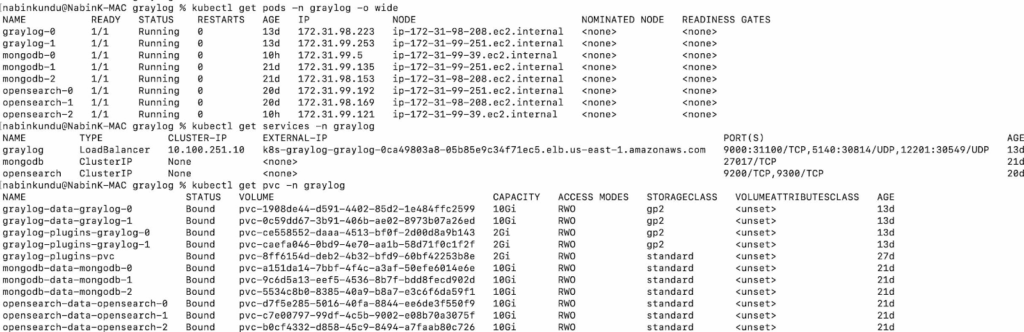
Once the OpenSearch is setup, you can expect to see pods and pvc similar to this:
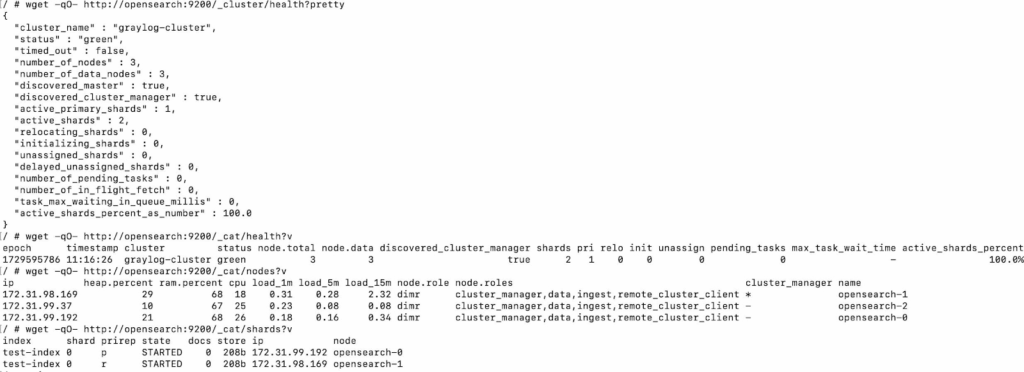
I verified the OpenSearch cluster health to make sure everything was in sync:
Step 4. Setup Graylog cluster
With MongoDB and OpenSearch running, I set up the Graylog cluster.
For that, I need to configure ELB to distribute the load and point the Graylog StatefulSet to our existing MongoDB and OpenSearch.
First, I created the Graylog service for ELB. You can run the following command to apply Graylog service configuration:
kubectl apply -f graylog-service.yaml --namespace=graylog
Then, I deployed the Graylog StatefulSet:
kubectl apply -f graylog-statefull.yaml --namespace=graylog
To verify that the Graylog cluster is working properly, I ran following curl command:
   curl -u user:password http://<graylog_elb>:9000/api/cluster?pretty=true
     {
	"8f4a7940-8286-4637-8d60-b6feaa8b9d7f" : {
	"facility" : "graylog-server",
	"codename" : "Noir",
	"node_id" : "8f4a7940-8286-4637-8d60-b6feaa8b9d7f",
	"cluster_id" : "a0c78658-6ec3-4b64-b2b6-3c36fd26a737",
	"version" : "5.2.4+ec33db8",
	"started_at" : "2024-10-28T14:59:11.881Z",
	"hostname" : "graylog-1.graylog.graylog.svc.cluster.local",
	"lifecycle" : "running",
	"lb_status" : "alive",
	"timezone" : "Etc/UTC",
	"operating_system" : "Linux 6.1.92-99.174.amzn2023.x86_64",
	"is_leader" : false,
	"is_processing" : true
	},
	"65c63714-f09d-453d-913a-788a4f07c743" : {
	"facility" : "graylog-server",
	"codename" : "Noir",
	"node_id" : "65c63714-f09d-453d-913a-788a4f07c743",
	"cluster_id" : "a0c78658-6ec3-4b64-b2b6-3c36fd26a737",
	"version" : "5.2.4+ec33db8",
	"started_at" : "2024-10-28T14:59:00.442Z",
	"hostname" : "graylog-0.graylog.graylog.svc.cluster.local",
	"lifecycle" : "running",
	"lb_status" : "alive",
	"timezone" : "Etc/UTC",
	"operating_system" : "Linux 6.1.92-99.174.amzn2023.x86_64",
	"is_leader" : true,
	"is_processing" : true
     }
  }
The expected output should look similar to this:
Step 5. Ingest logs into Graylog
With the cluster running, I started ingesting sample logs into Graylog using Syslog UDP, Gelf UDP and the Netcat command line. For production scenarios, it is preferable to use Gelf UDP.
Using Syslog UDP:
- Go to the Graylog user interface:
URL: https://<graylog_elb>:9000/system/inputs
- Set up the Syslog UDP input, ensuring to designate nodes as global to distribute the load across the 2 nodes.
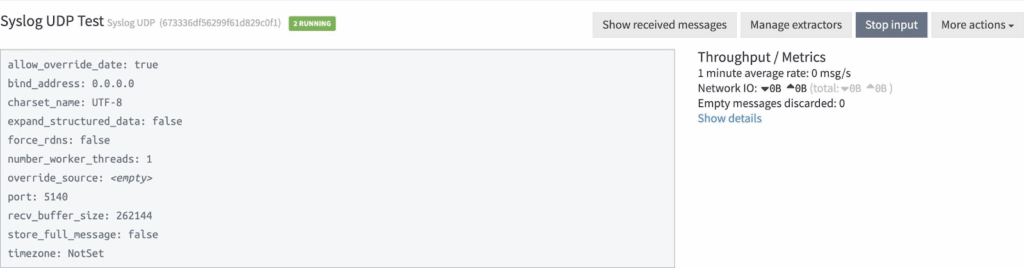
- To ingest logs, use the following command:
logger --server <graylog_elb> --port 5140 "This is a test log message for Graylog."
Using Gelf UDP
- Set up the Gelf UDP input in the Graylog user interface.
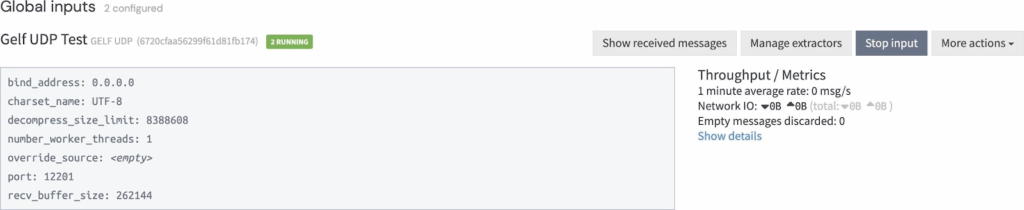
- To ingest logs, use the command below:
  echo '{"version": "1.1", "host": "test-client", "short_message": "Test log via netcat", "level": 1}' | nc -u -w 1
       <graylog_elb> 12201
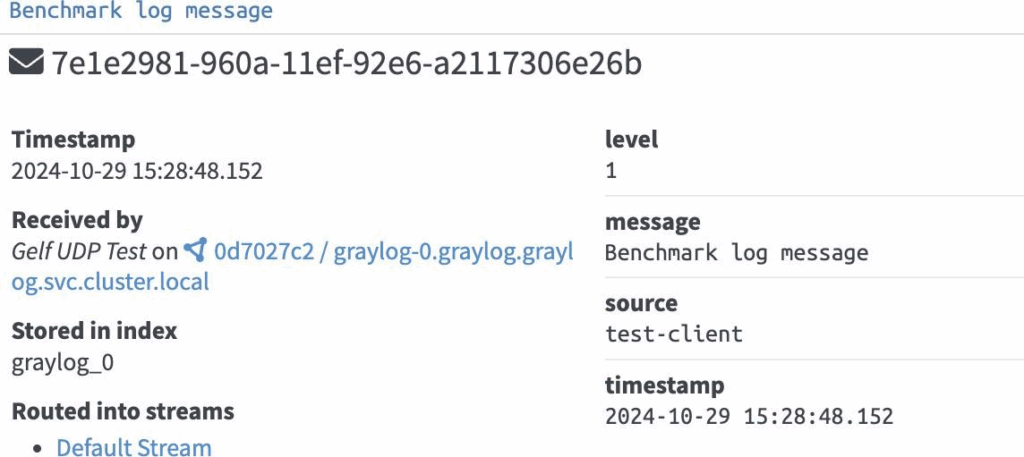
Ensure you ingest multiple messages and check if it is getting distributed in multiple nodes. Notice that one of the message is received by graylog-1 node and the other is received by graylog-0 node:

Step 6. Configure storage and capacity
I provisioned persistent volumes for log data and metadata. For example:
| PVCs | CAPACITY | STORAGECLASS |
| graylog-data-graylog-0 | 10Gi | gp2 |
| graylog-data-graylog-1 | 10Gi | gp2 |
| graylog-plugins-graylog-0 | 2Gi | gp2 |
| graylog-plugins-graylog-1 | 2Gi | gp2 |
| mongodb-data-mongodb-0 | 10Gi | standard |
| mongodb-data-mongodb-1 | 10Gi | standard |
| mongodb-data-mongodb-2 | 10Gi | standard |
| opensearch-data-opensearch-0 | 10Gi | standard |
| opensearch-data-opensearch-1 | 10Gi | standard |
| opensearch-data-opensearch-2 | 10Gi | standard |
Number of Pods:
- Graylog – 2 (each with mem 1Gi and cpu 500m)
- Mongo DB – 3 (default)
- OpenSearch – 3 (default)
Step 7. Test fault tolerance
To validate resilience, I deliberately brought down one node.
We have 2 Graylog nodes, one of them is master and the other one is slave. Currently we are setting this in “initContainersˮ section in the manifest file itself. If the master goes down, then Kubernetes is responsible for bringing it up.
Graylog itself does not provide automatic leader election. It depends on an external mechanism or manual configuration for leader assignment. This is different from distributed systems like Elasticsearch, which have built-in leader election.
Once we have all the nodes up, then we need to update the config file
"/usr/share/graylog/data/config/graylog.confˮ to elect one of them as leader by setting the config "is_leader = trueˮ.
However, the data which is being ingested to Graylog is indexed into OpenSearch which has built in leader election process. Also, we can create indices with required shards and replicas which will be responsible for high availability of the data. Mongo also has its own primary node election process.
Regarding alerts, currently we havenʼt setup any alerts in the Graylag cluster, but we can set them up from the UI alerts section.
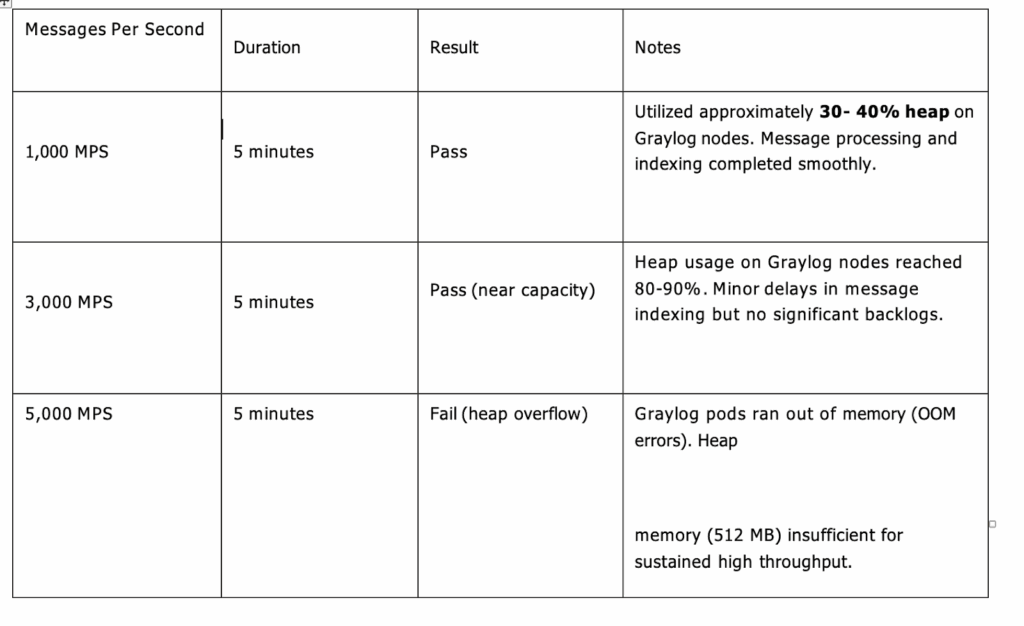
Step 8. Benchmarking
Finally, I tested how the cluster handled increasing load.
Challenges I faced
Not everything worked smoothly the first time. After completing the setup, I noticed that Graylog wasn’t ingesting any message. The issue turned out to be a connectivity problem i.e. the Graylog pods was unable to connect with MongoDB cluster.
To debug this, I created a BusyBox pod (linux box) and tested connectivity for both MongoDB and Open Search. While trying to telnet to the MongoDB from the Graylog pod, it was unable to recognize the MongoDB cluster. To fix it I had to run all the 3 components (MongoDB, OpenSearch and Graylog) in the same network host using docker. Once the MongoDB was pingable from the Graylog cluster, I was able to ingest messages.
Conclusion
Setting up a Graylog cluster ensures high availability, scalability, and resilience for centralized log management. By distributing responsibilities across multiple nodes, the system can handle larger workloads, minimize single points of failure, and provide consistent access to logs even during node failures or maintenance. Integrating load balancers, properly configuring cluster roles, and leveraging persistent storage further strengthens reliability.
With this setup, organizations gain a robust foundation for monitoring, troubleshooting, and analyzing logs at scale, empowering teams with greater visibility into their infrastructure and applications. As log volumes continue to grow, a well-architected Graylog cluster positions the platform to adapt seamlessly to future needs while maintaining performance and stability.