


We start learning React and jump into the concepts of hooks, state management, props and rendering. Memory management and what happens with memory when our app runs stay neglected. But it starts haunting us soon when memory starts leaking. It makes our apps slow and sluggish on long hours of usage in production. Memory leak is not a one-off event but a gradual process of memory usage accumulating over time.
- Invisible at first. In long-lived sessions like a dashboard left open all day, a chat window, or an editor, memory gets accumulated until the page becomes slow or even crashes.
- Hidden in ordinary code. They can be found in regular codes that we write on a day-to-day basis.
- Hard to pinpoint the cause. “Feels slow” is a symptom that we see long after the cause has already happened, so it becomes difficult to pinpoint the exact cause
The good news is nearly all stem from one root cause. Once you can see it in DevTools, it becomes easier to identify and fix them.
The mental model: one root cause, many faces
Ideally, memory must get released once the program finishes running. The GC frees everything that is unreachable. Leaks happen when something you don’t need turns out be reachable and GC kept it alive.
Two steps define every leak: first, you have a reference created (a subscription, a captured closure, a cache entry both intentional and correct), second it stays post usage (the component unmounts, the task ends, the user navigates away) with nothing releasing it.
How React holds memory
GC looks at a value retained if that is accessible via any GC root. GC roots are always live: window, module scope, the call stack, and React’s own roots. In a React app, we mostly write two kinds of code- one that lives within the React boundary (React owns and controls it) and another that lives out.
Within React — released on unmount. For a component, React allocates its state, props on React Fiber. A simplified version looks something like this
React root (GC root)
  → Fiber (mounted component)
    → memoizedProps      // props passed in
    → memoizedState      // the hook list
      → your objects
When a component unmounts, React drops its fiber and everything reachable only through it becomes collectible. So component-scoped bloat — a heavy useMemo, oversized state, a giant prop — gets released on unmount (provided nothing else is referencing it)
Outside React — survives unmount. The dangerous path:
window / module scope (GC root)
  → listener · cache entry · timer
    → closure → captured scope
      → your objects
A window listener, a module level Map, a setInterval is rooted outside React and keeps a closure alive, pinning every variable it captured. Unmounting changes nothing because it is not being held by React Fiber. That’s why these persist.
Methodology: How to identify a leak (Only for Chrome browser)
Start your application, go to Devtools and switch to Memory tab
- Live memory usage: You will see current memory being used by your app
- Take a baseline snapshot: Click on ‘Take snapshot.’ You get a window showing detailed and granular memory allocation of your app.
- Run the probable leaky path, then snapshot again: Mount/unmount, scroll, or open/close a few times. Let the app cool down for a few seconds and then force garbage collection by clicking the ‘Trash’ icon on the top left. Then take another snapshot.
- Memory allocation diff: A substantial difference in two snapshot sizes indicates a memory leak. Select ‘Objects allocated between snapshot 1 and snapshot 2’ from the dropdown
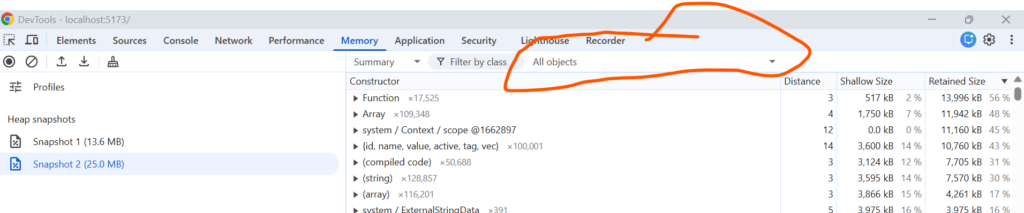
This will give you the allocations done after you ran the leaky path that were not there when the app was loaded.
- Read the retainer chain. Sort the list by ‘Retained Size’ in descending order. Click on one of the entries. You will see a Retainer window load up with a complete path from the GC root to your held object.
- Mapping the retainer chain to your code. Try to get a hint from the retainer chain and map it to your code. This will help you pinpoint the code causing the leak. Once identified, fix it and run the whole process again to see if memory still leaks or is healed.
Note – Check E.1 to see the Chrome DevTools screenshot captured for a leaky operation.
Tips –
- The entry itself is using less memory if it has a small, shallow size but a large, retained size. This means something else is using a large amount of memory, which is a red flag and points to a memory leak.
- Multiple entries in the snapshot may share the same retainer chain but appear at different depths within it. Simply put, they are all strung along the same reference path. If you sever that path at its root, you cut the entire chain at once. This frees every object that was retained along it, including the one you were directly investigating.
Examples of memory leak
Let me explain what I have mentioned earlier with three examples. There will be a leaky code, its fixed counterpart and the retainer chain. For E.1, I have added a screenshot of the devtools showing how the leaky code caused a memory leak and how the retainer chain helps us point out to the cause.
E.1 — Uncleaned Effect
Pattern: subscribe on mount, forget to unsubscribe.
LEAKY
useEffect(() => {
  const data = allocateSomeObjects();
  const reLayout = () => calculateCoords(data);
  window.addEventListener('resize', reLayout);
  // no cleanup
}, []);
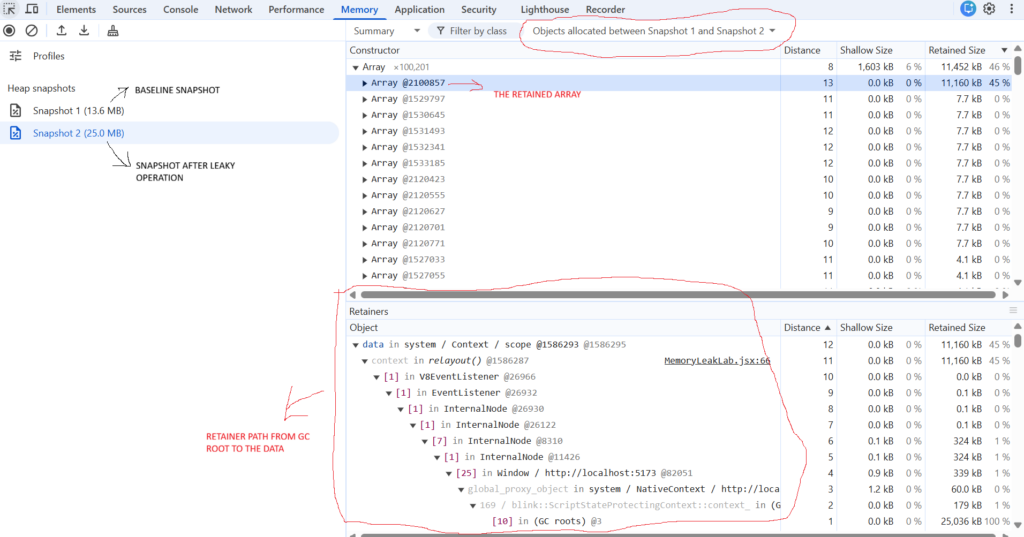
Here, reLayout’s closure holds the data, V8EventListener holds reLayout, and the chain routes to the GC root. As its output, the retainer chain will list down too many internal details. This can be checked if we pick up things only that is related and maps to our code, and ignore the internal stuff. In this case, if we remove the event listener, the chain breaks and ‘data’ gets garbage collected.
FIXED
useEffect(() => {
  const data = allocateSomeObjects ();
  const reLayout = () => calculateCoords(data);
  window.addEventListener('resize', reLayout);
  return () =>
    window.removeEventListener('resize', reLayout);
}, []);
E.2 — Unbounded Cache
Pattern: a module-level Map memo cache with no eviction. Every call adds, nothing removes.
LEAKY
const lastSearchResultsCache = new Map();
function memo(rows) {
  const key = uid();        // unique every call
  lastSearchResultsCache.set(key,
    () => use(rows));       // captures rows
}                           // never evicted
FIXED
const lastSearchResultsCache = new Map();
function memo() {
  cache.set('searchCache',       // stable key
    () => use(makeRows()));
  // captures makesRows() and not the rows itself
}
Two problems here: a unique key per call (entries only accumulate) and a closure capturing `rows` (each entry pins complete dataset). You need a proper cache eviction mechanism and don’t capture heavy data.
Exercise – use this leaky code snippet and run inside your app and follow the methodology that we discussed and try to find out the retainer chain. The retainer should roughly look like this:
RETAINER CHAIN lastSearchResultsCache Map → closure scope → dataset
E.3 — Always-Mounted Component
Pattern: a component kept mounted (just hidden) while holding heavy props.
LEAKY
<ExportModal
  open={false}
  record={bigRecord} />
// stays mounted → props hold record
FIXED
{open && (
  < ExportModal
    record={bigRecord} />
)}
// unmounted when closed → record prop gets freed
In the leaky code, we just hid the component and not unmounted it. If a component remains mounted, its fiber remains alive, which in turn keeps the props and states alive.
RETAINER CHAIN memoizedProps (on the mounted fiber) → record
Fixes to these examples may seem obvious as I have presented them without the backstory. Real production codebases are more complex as the leaking code there remains buried across hundreds of files. Often such a code is syntactically correct, logically reasonable, and passes every test, while silently accumulating memory across long running user sessions. The methodology I presented becomes invaluable to counter such cases. Snapshots surface what code inspection cannot.
Key takeaways
- A leak is not a GC failure but a reference that outlives its need.
- Same bug can cause multiple troubles by affecting effects, caches, mounted props, etc.
- Pair every setup with a teardown like subscribe/unsubscribe, set/clear, mount/unmount, cache/evict.
- Worst in long-lived, high-churn screens: dashboards, feeds, chat, editors, routes, lists, modals.
Please note that while examples shown are React specific, the methodology to identify leaks holds good for other JS web apps as well because at the end it’s JS and the browser